
 +(91) 9867215033
 info@ujjwalengineers.com
 Maharashtra, Gujarat, India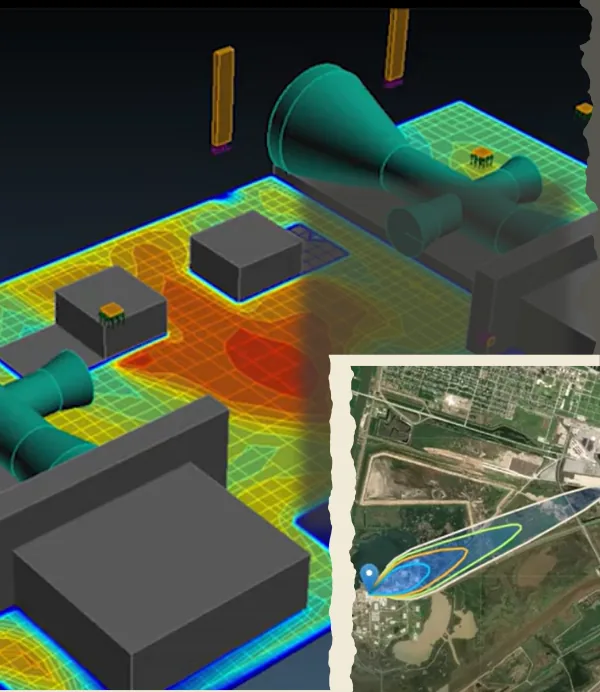
What a QRA answers
A Quantitative Risk Assessment converts hazard scenarios into numbers: how often a release is expected, how it disperses or ignites, how far the harmful effects reach, and what that means for people on site and outside the fence.
It exists to answer questions a qualitative study cannot: is this the right place for this unit, is the separation distance defensible, who needs to be in the emergency plan, and has risk been reduced as low as reasonably practicable?
The method, in the order we run it
- Scenario selection. Loss of containment cases drawn from the HAZOP, the inventory list and the plant layout.
- Frequency estimation. Failure frequencies from recognised databases, adjusted for the protective systems actually installed and maintained.
- Consequence modelling. Dispersion, pool and jet fire, flash fire, BLEVE and explosion overpressure - covered in more depth under consequence and dispersion analysis and fire and explosion risk analysis.
- Risk summation. Frequency and consequence combined across weather classes and wind directions to give individual and societal risk.
- ALARP demonstration. What else was considered, what it would cost, and why it was or was not adopted.
Inputs decide the answer
A QRA is only as good as what goes into it, and two inputs are routinely weak. The first is meteorological data - a generic regional wind rose instead of site-representative data changes the contours and the conclusion. The second is population data, which is often taken as a headcount rather than a distribution across shifts and buildings, and societal risk is entirely driven by that distribution.
Where terrain, congestion or building geometry make standard integral models unreliable, we move the affected scenarios to CFD rather than accepting a result the geometry does not support.
What you receive
- Individual risk contours overlaid on your plot plan.
- Societal risk as an F-N curve, with the assumptions stated.
- A ranked list of risk-driving scenarios - usually a short list, and usually not the ones the site expects.
- Recommendations separated into what reduces frequency and what reduces consequence.
- An ALARP argument written to be read by a regulator, not only by an engineer.
Where it is used
QRA output supports environmental clearance and consent applications, MAH obligations, on-site and off-site emergency planning, insurance and lender due diligence, and layout decisions on brownfield sites where space is the constraint. We deliver studies across Mumbai and Navi Mumbai, Ankleshwar, Vapi and Pune.
Frequently Asked Questions
What is the difference between a QRA and a HAZOP?
A HAZOP is qualitative and asks what can deviate from design intent. A QRA is numerical and asks how likely each outcome is and how far its effects reach. A QRA usually takes its scenarios from the HAZOP, so the two are sequential rather than alternative.
What data do you need from us to run a QRA?
P&IDs and PFDs, plot plan and equipment layout, inventories and operating conditions, isometrics or line lists for the major hazardous streams, protective system details, site-specific meteorological data, and population distribution on site and in the surrounding area. Weak inputs are the main reason a QRA result cannot be defended.
Is a QRA mandatory in India?
It is not universally mandatory, but it is frequently required - as a condition in environmental clearances, for Major Accident Hazard installations, under sector rules such as those applying to petroleum and gas installations, and by insurers and lenders. Where siting or land use is contested, it is effectively expected.
What does the QRA actually produce?
Individual risk contours plotted on the plot plan, societal risk expressed as an F-N curve, a ranked contribution list showing which scenarios drive the risk, and an ALARP demonstration setting out what further reduction was considered and why it was or was not adopted.
How long does a QRA take?
For a single plant with reasonable data, four to eight weeks is typical, most of which is data assembly and validation rather than modelling. Large multi-unit sites or complex terrain requiring CFD take longer.





 As per MOEF & CC’s (Govt. of India) Office Memorandum F.
No. 22-34/2018-IA.III dated 9th August 2018 Self-Environmental Audit shall be conducted annually. Every
three years third party environmental Audit shall be carried out.
As per MOEF & CC’s (Govt. of India) Office Memorandum F.
No. 22-34/2018-IA.III dated 9th August 2018 Self-Environmental Audit shall be conducted annually. Every
three years third party environmental Audit shall be carried out.